
Data Producer-Consumer Diagrams: Understanding Your Data Estate
Looking at your data estate through the lens of data producer-consumer pairs helps you to integrate people, processes, technology, and data into a single framework to improve your workflows.

Read time: 8 minutes
Introduction
A strong foundation is essential to determining whether or not data initiatives will be successful or not. In today’s fast-evolving data landscape, the relationships between those who produce data and those who consume it is more important than ever. When these connections are well-defined and supported by thought-out processes, organizations can efficiently ingest and exploit new data sources and tackle new use-cases.
The relationships between producers and consumers form the backbone of an organization’s data strategy. When in sync, organizations can avoid investing in unnecessary capabilities and instead focus on improving the workflows and integrations that matter most. Looking at your data estate through the producer-consumer lens at different levels of granularity helps to define and improve how you integrate people, processes, technology, and data.
This is intended to be an introduction to thinking about data producer-consumer pairs and to keep things as simple as possible we focus on unidirectional flow (left to right). Real-world systems naturally involve some bidirectional communication and iterative feedback which we will discuss in another article. This article aims to introduce the idea of producer-consumer diagrams and give you practical insights so you can improve your data operations.
Throughout this article, we mention three terms repeatedly, which we define here:
- Data Producer: An individual, team, or system responsible for generating or capturing data. Their processes and actions directly influence data quality, timeliness, and reliability.
- Data Consumer: An individual, team, or system that relies on data to achieve their goals; whether analytical, operational, or strategic. Their requirements guide what data should look like and how it should be delivered.
- Handover: The interface where data is passed from a producer to a consumer. Each handover offers an opportunity to ensure that data meets agreed standards (e.g. for data quality) and compliance (e.g. data governance and management).
A Practical Example of Data Producers and Consumers
When thinking about data workflows, it's vital to understand the relationships between data producers and consumers. Although this may seem like a simple exercise, it can become quite complex. As you increase the granularity, you encounter an ever-growing network with more producer-consumer pairs.
Let's take a simple example:
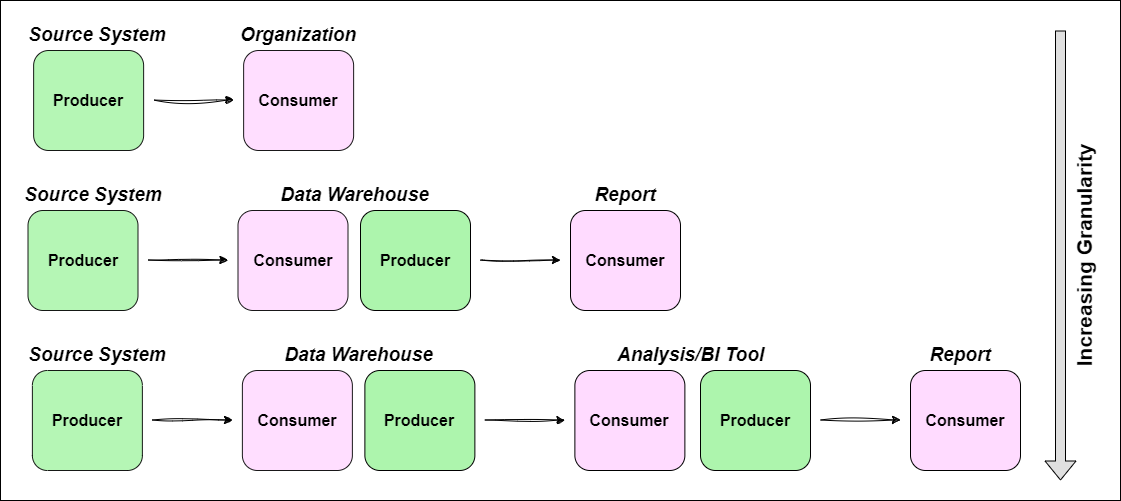
An external system produces data which is ingested into (consumed by) an internal data warehouse (see the top line in Figure 1).
But wait a minute, the data doesn't just sit in the data warehouse. Curated datasets are produced and fed into (consumed by) various reports. Now the data warehouse shifts from being just a consumer to both a consumer and producer (see the second line in Figure 1).

The two examples in Figure 1 show that producer-consumer diagrams, in their simplest form are unidirectional networks where each node corresponds to an entity (more on qualifies as an entity later).
Comparing the examples makes it clear that context matters. Adding an extra node to the network can cause other nodes to change from just a consumer to a dual consumer/producer. This context is what makes producer-consumer diagrams so powerful; you can map out both existing and potential integrations within your organization and see the impact on your wider data estate.
What Granularity Should You Look At?
It should be clear that the number of producer-consumer pairs increases with the level of granularity you look at. When looking at a high level, you’re effectively grouping nodes together to build a more conceptual model of your data estate. At a finer granularity, specific tools, teams, or services can be represented by their own nodes in a more physical producer-consumer network. This parallels data modelling where we have conceptual, logical and physical data models, which capture different aspects of how we handle data.
Building on our previous example (in Figure 1):
At the highest level: An external system produces data that is consumed and exploited by your organization. This is a two node network.
One level down: You might separate internal operations into the data warehouse and the reporting functions. This is a three node network.
Even further: You may want to break out the reporting node into two; one for analysis/BI and one for reporting functions. This is a four node network.
And so on: This create an N-node network.
This progression is illustrated in Figure 2.
There’s no rule about what level of granularity to look at and choosing this is as much art as it is science. This is a hierarchical approach and the appropriate level will depend on your goals. The highest (most conceptual) level would be useful for identifying relationships with external services whereas level 3 might be useful if you're trying to improve internal processes for an end-to-end workflow, from ingestion through to reporting.
So What’s the Point?
If you work within an established data capability, you're likely familiar with standard documentation that maps your data estate, such as:
Data catalogues and business glossaries (they map data)
Architecture diagrams (they map technologies and integrations)
Organization charts (they map teams, people, roles and responsibilities)
Process documents (they map business processes and operating procedures)
These are all important, living documents that should be reviewed and updated regularly to reflect your estate. Producer-Consumer diagrams aren’t meant to replace any of the above but instead act as a complementary tool that integrates various aspects of people, process, technology and data.
Again, let's take a practical example. Consider a typical workflow involving data ingestion, transformation and analysis, and report creation. This workflow is captured in Figure 3.
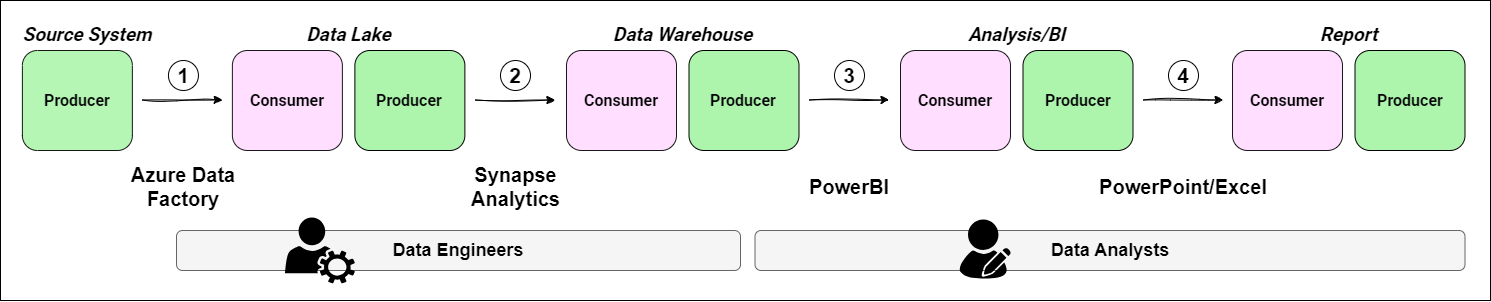
We have enriched this diagram by adding the technologies involved at each handover and mapping roles to sections of the workflow. In this idealized example, we assume the data capability consists of two teams; data engineering and data analysis (though in your case, you might also include analytics engineers or data scientists).
Each handover represents a point of integration, where data is passed from one system or person to another, or between two systems. These handover points are where issues are most likely to occur; this approach helps you proactively identify opportunities to improve your workflow. Each handover should be evaluated to ensure that the people, processes, technology and data requirements are all fully addressed. I still refer to this collection of requirements as data acceptance criteria (even though these have been rebranded as data contracts recently).
Here are some key considerations for each handover:
Handover 1: Data ingestion from an external system
Data from an external system is brought into your data estate.
Do you have well defined acceptance criteria agreed with the external supplier?
This should include things like the:The file format(s) delivered
Data contents (columns, data types, etc.)
Data quality requirements (e.g. the number of nulls that are permitted)
Documentation (specifically mentioning changes to their process)
A delivery schedule if data is routinely delivered
Handover 2: Data transformation and curating datasets
Raw data is read from the data lake, transformed and curated datasets are saved to the data warehouse. Acceptance criteria involves:How the data is loaded (it’s structure, update frequency, etc.)
Evaluating data quality and ensuring remediation rules are met
How the data models should be documented
Proper implementation and management of data access
Handover 3: Loading data into the BI tool
Datasets are read from the data warehouse and loaded into BI tool.
Here, the requirements are not just technical but also people related; data engineers and analysts must collaborate to ensure data is ready for analysis. The acceptance criteria might include:Agreed communication channels for submitting requirements between teams
Verification that data analysts have access to data they need
Expected documentation of the data and it’s lineage
Agreed-upon schema for data models
Handover 4: Sharing insights with stakeholders
Insights are shared in reports for stakeholder review. The acceptance criteria might include:Quality assurance of aggregations and derived insights
Style guides for visualizations
Governance checks to confirm that data can be shared appropriately
Even in this simple example, we have identified four handovers that we can use as opportunities to improve our workflows, manage data quality and governance, ensure quality assurance, and integrate the four pillars of people, processes, technology, data.
Some of the biggest wins I’ve experienced using this approach has been in data quality management. By identifying handovers, data consumers can provide direct feedback to their respective data producers, facilitating a multi-team approach to ensure that data meets the desired quality standards at every phase. This collaborative approach aligns data supply with demand, leading to better data-driven decision-making and improved business outcomes.
By understanding the roles and responsibilities of data consumers and producers, organizations can establish clear communication channels, define relevant data quality metrics, and implement processes that enhance the overall data quality.
Possible Extensions
This article’s aim was to introduce the approach of mapping your data estate using data producers and consumers. We’ve restricted our examples to a small number of roles and technologies so that we could focus on the fundamental concepts. I hope you found this approach engaging and easy to follow!
Different Nodes, Similar Networks
We have focused on using data functions as the nodes in our network for clarity, but it’s equally valid to instead use technologies or teams to map out your data estate. If you use datasets as the nodes, the resulting network is actually a data lineage graph! Cool, huh?!
Extending Beyond Data
Although I’m focused on using this approach to map out data workflows, it can just as easily be applied to adjacent fields. It works just as well for software design (where you have connected databases, APIs, and frontend interfaces) and for machine learning/artificial intelligence systems (where data and models interact).
Additional Roles
In operational environments, you might want to extend this approach to a broader array of data consumers and producers. These might include:
Data Consumers:
Operations teams: Rely on accurate data to streamline processes, optimize workflows, and improve efficiency.
Customer service representatives: Need up-to-date and comprehensive customer data to provide personalized support.
Data Governance Teams: Expect organizations to maintain data that meets compliance and reporting standards.
Data Producers:
Frontline employees: Input customer information, product details, and other operational data into the organization's systems.
IT teams: Manage the data infrastructure, including databases, data pipelines, and data integration processes.
Data stewards: Oversee data governance policies, data quality standards, and data management practices.
Conclusion
As organizations try to become more data-driven, their ecosystem becomes increasingly complex, with multiple interfaces and integrations spanning teams and technologies. The key to reducing technical debt and maximize the success of data initiatives is ensuring that people, processes, technology, and data are effectively governed and managed across your entire data estate.
Understanding the producer-consumer relationships within your workflows helps identify pain points and enables you to address issues proactively or retroactively. Looking at your data workflows through this lens can help integrate and unify the documentation that describes and defines business processes, technology interfaces, and team interactions.
Despite all the hype around "data contracts", it's surprising that there is little-to-no discussion of data producer-consumer pairs, even though these relationships underpin data contracts and inform their contents. I think it’s really cool that you can create producer-consumer diagrams at different levels of granularity to resolve specific issues, with the nodes being able to represent technologies, teams/roles, or even datasets.
To receive new posts and support our work, become a free or paid subscriber today.If you enjoyed this newsletter, comment below and share this post with your thoughts.